Beyond the Numbers: The Truth about Analytics

What metric matters most to you?
You need to answer this before indulging in the statistical playground of analytics. Being truly data-driven means treating analytics feedback as GPS instructions for your site and/or campaign, whether for your internal team or clients. These numbers don’t provide the destination but show you the way. Ultimately, you’re driving the vehicle.
It’s best to think of analytics as a forecasting tool or an accurate predictor of your site’s performance. When your site’s stats are properly mined for insights, be it from Google Analytics or Oribi, your team can better figure out what objectives to focus on and where to best allocate resources. When correctly applied, these decisions are designed to prevent loss and promote growth for you and your clients.
Like content, analytics is something every organization values. But few understand how to best leverage it.
What usually goes wrong with analytics is that the numbers on the dashboard are given no context or appropriate weight. Vanity metrics such as bounce rate and page views are fawned over but don’t intrinsically have any value — bounce rate, in particular, is infamously misunderstood.
If you’re evaluating the performance of your landing page, a user shouldn’t be there for long anyway — so how quickly they bounce off doesn’t equate to much of anything. You need to be looking at why users are on certain pages, what kind of engagement you want from them, and what’s the purpose of your page(s).
Dictionary for Numbers
As with any niche field in the digital, there’s a deluge of specific terminology in analytics that can seem overwhelming. Here are some of the basics:
- Custom Segment: focused on particular sections of your traffic based on users and sessions
- Channel: high-level categories for inbound marketing, e.g., Organic Search, Social, Email, et al.
- Direct Traffic: users who arrive at your site by typing your URL directly into their browser
- Engagement: particularly relevant for Social, this is usually quantified in Likes, Comments, and Reshares.
- Event: a custom interaction tracked on your site, e.g., clicking the Donate CTA button or playing a video embed
- Goal: tracking desired actions, such as triggering a high-priority Event
- Organic: users that find your site through a search engine
Analytics Tools + Toys
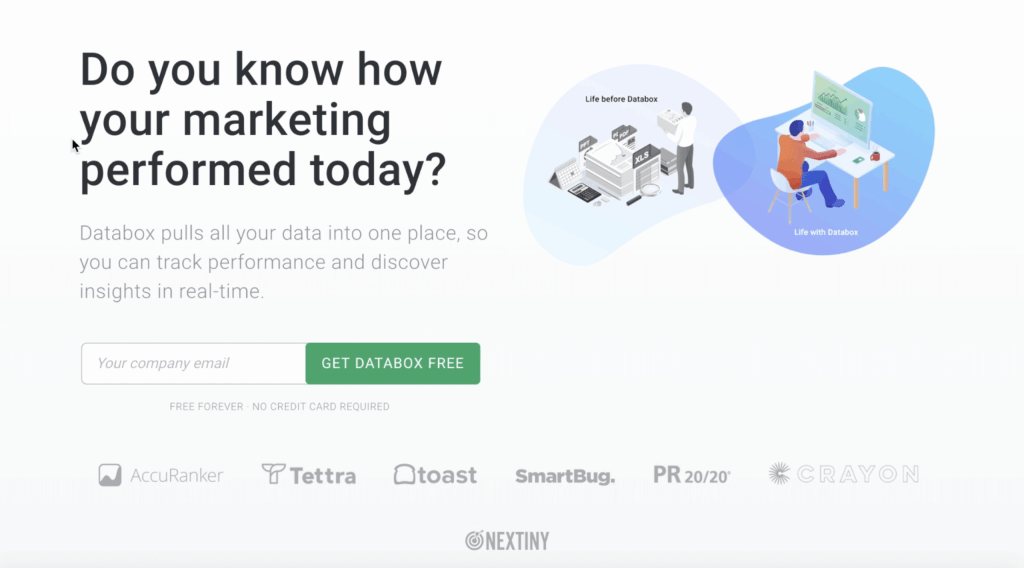
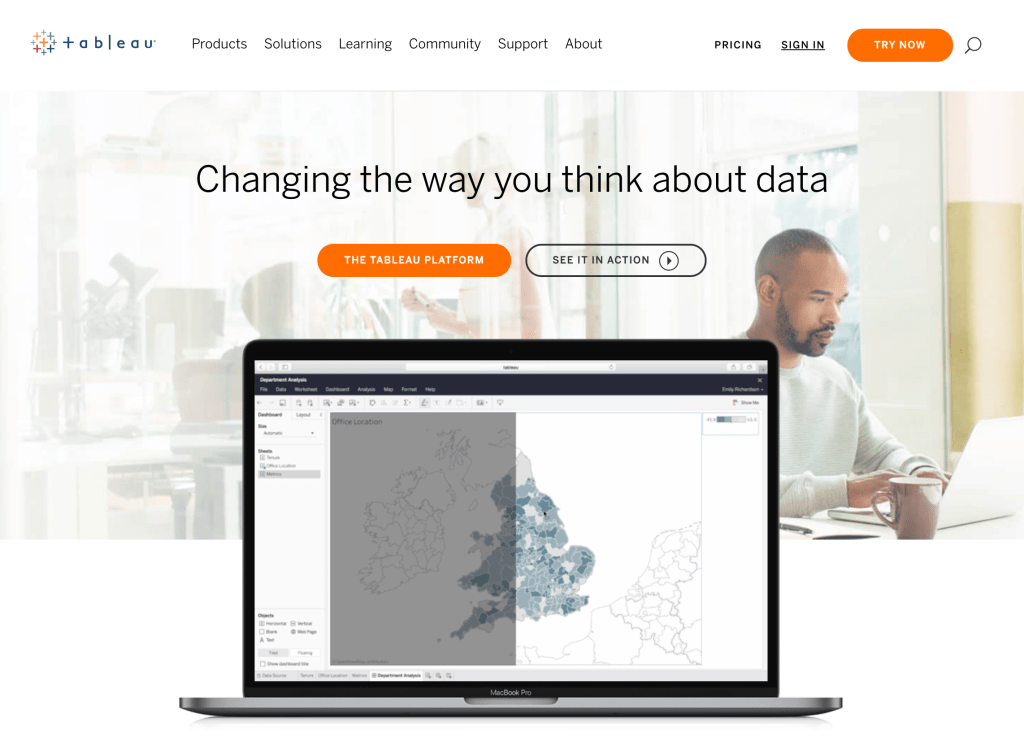
Here’s a stat for you: there are dozens of top analytics tools on the market today and more are being released all the time. But no matter how shiny all these dashboards or infographics may be, the impact of these will still rely mostly on the potency of your analysts, marketers, and cohesion of your team’s mission/vision.
The Forecast Calls for Data
The best analytics illustrate a relationship or tell a story between particular page traffic and a certain desired engagement. Event correlations are perfect for this: X amount of users who visited our homepage clicked on the contact CTA, yielding X conversion rate.
- Overrated: Page Views / Sessions / Bounce Rate
- Underrated: Segmented Demographics / Frequent Users
- The real value is in your premium single-digit traffic.
Having a correlation between your sales funnel and your site’s analytics will immediately get everyone to pay more attention, which is always the case when you throw a dollar sign before a piece of data. This empowers analysts and in turn, marketers — spotlighting which content, pages, initiatives, and campaigns are most worthy of your bandwidth and most beneficial for your ROI.
The ideal analytics approach is converging business and digital metrics.
Before embarking into dense dashboards of stats, your team first needs a success-engagement equation:
- Number of frequent users hitting certain engagements
- Have two figures in mind you want to reach as an organization
- For instance, ‘non-bounce acquisition’ plus two key events
- Key events should feed directly into the value/offerings of your organization:
- Associations: Members
- Nonprofits: Donations
- Corporate: Revenue
- Marketing: Brand
What is Measured is Managed
This continued practice of business analytics fits its natural forecasting model. Over time, your organization will compile average monthly and end-of-year sales projections based on these numbers. What’s best is that these stats will continue to get more and more accurate as time goes on.
Analytics is most used for marketing — which isn’t wrong — but it’s best used when it answers questions.
Your team should always know what they’re looking for prior to tracking any metrics. Analytics can potentially be harmful if you misinterpret the stats or use it as a starting point for business/marketing decision-making. Metrics are a guide; not the end-all, be-all truth.
Remember, not all traffic is created equally. One user with the right engagement could change everything for the better while thousands of hits in trash traffic could leave your team looking for patterns that aren’t even there.
Analytics can tell you nearly everything about your digital presence: who your users are, what they do while they’re on your site, where they’re clicking, and when they’re coming to your page.
It tells you everything but why (at least for now).
The psychology of why your users, clients, and team are doing any of this is ultimately your own deduction. And if you can figure out that metric, your organization’s success will be immeasurable.